 In the opening scene of Mission Impossible 2, Ethan Hunt receives a message at the top of a sandstone butte. He puts on the glasses and listens to the message, which ends with the computer-generated phrase: “This message will self-destruct in five seconds.” Ethan throws the glasses, and they explode.
Analysis in the current climate lasts more than five seconds, but it is vulnerable to self-destruction in five days. Keep this in mind when digesting reports and analyzing charts. We are in an extremely fluid and volatile period right now.
Note that the stock market timing model at TrendInvestorPro turned bearish in mid-March and remains bearish. Wednesday’s 10.5% surge in SPY was impressive but not enough to reverse this signal or trigger a bullish breadth thrust. Follow-through is what differentiates oversold bounces from bullish breadth thrusts. We will monitor our thrust models closely in the coming days and weeks. Click here to take a trial and get immediate access to all our reports and videos.
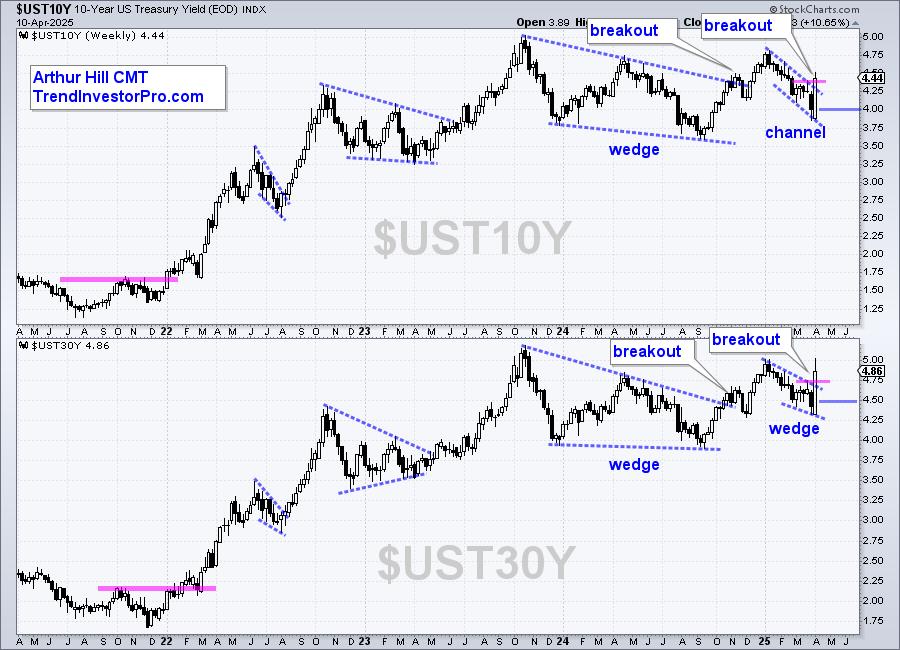
Now let’s turn to the bond market. Treasury bonds are plunging, which means long-term Treasury yields are rising—and rising sharply. The 30-year Treasury yield hit 4.86%, rising from 4.40% (+0.46 or 46 basis points). This is the largest 4-day rise in over 30 years. The 10-year Treasury yield is also on the move, hitting 4.44%. Safe-haven bonds are supposed to attract money when volatility and risk rise in the equity market. They are doing the opposite, and this is disconcerting. For history buffs, note that the bond vigilantes were also active from October 1993 to November 1994 as the 10-yr Treasury Yield rose from 5.2% to 8%.

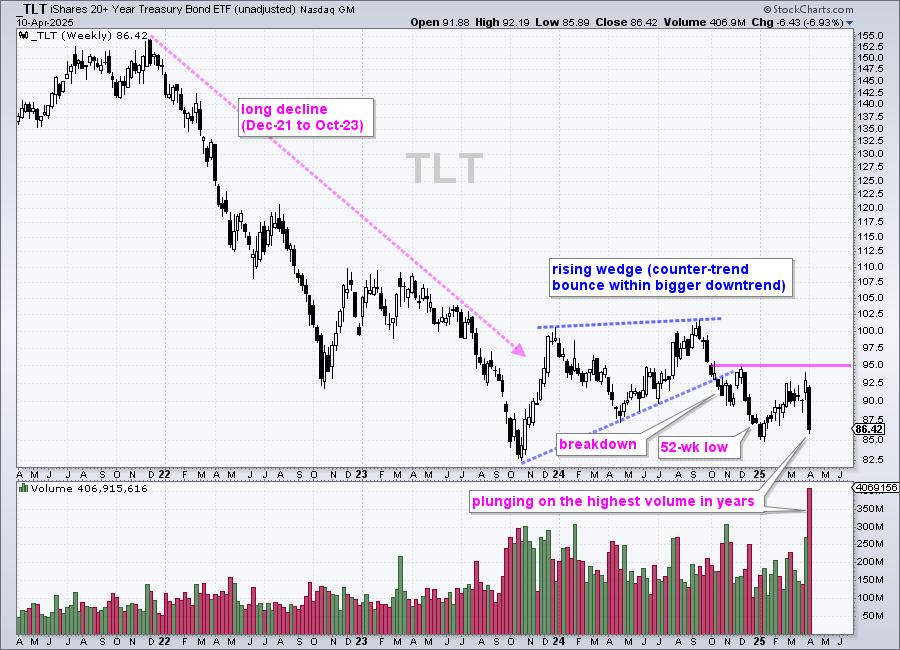
Bonds move in the opposite direction of yields, which means the 20+ Year Treasury Bond ETF (TLT) is breaking down. The chart below shows weekly candlesticks for TLT over the last four years. TLT fell from December 2021 to October 2023, formed a rising wedge into September 2024, and broke down in October. The ETF continued lower, recording 52-week lows in December and January. The wedge break signaled an end to the corrective bounce and a continuation of the larger downtrend. New lows are expected.

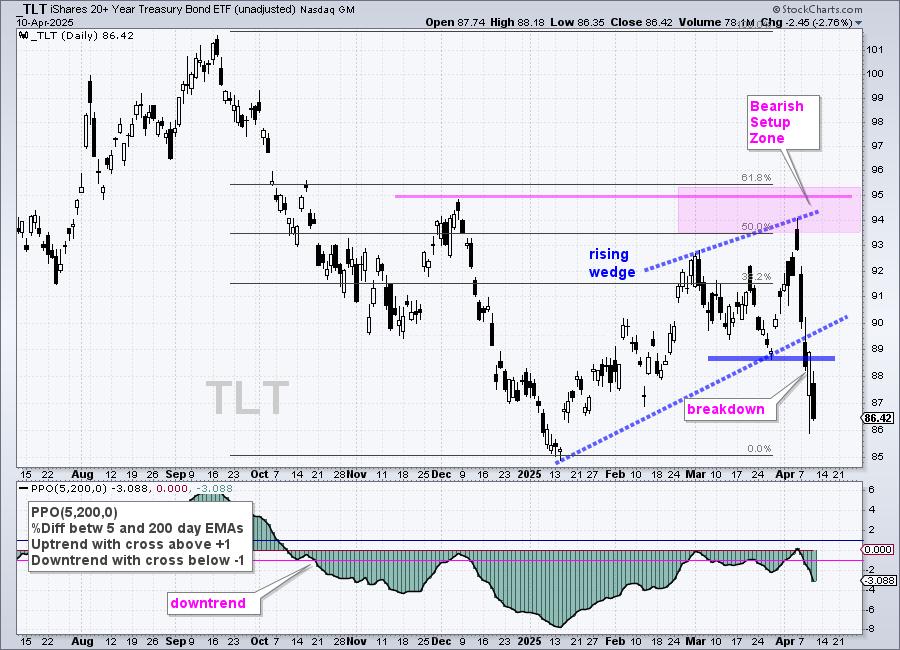
The next chart shows daily candlesticks over the past year. TLT fell sharply from mid-September to early January, rebounded with a rising wedge into early April, and broke down this week. Notice how TLT reversed in the Bearish Setup Zone (pink shading). The 50–61.8% retracement area and resistance from the early December high define this zone. During counter-trend bounces, I use these tools to define a potential reversal zone. TLT reversed with a vengeance this week and broke down.

The bottom window shows the PPO (5,200,0) with signal lines at +1% and -1% for signals. This indicator shows the percentage difference between the 5-day and 200-day EMAs. I use signal thresholds just above and below zero to reduce whipsaws. The PPO crossed below -1% in mid-October to signal a downtrend, and this signal remains in play. A move above +1% is needed to signal an uptrend and re-evaluate my bearish stance.
As with equities, bond market volatility surged over the last two weeks with TLT surging 5% from March 27th to April 3rd, and then falling 8% the last four days. These swings are based on intraday highs and lows. Volatility makes chart analysis challenging, but I will adhere to signals until they are proven wrong, which could be in five days. Be careful out there!
It was a busy week in the markets with TrendInvestorPro covering several key issues. We started the week by highlighting the 3 standard deviation decline in SPY and some extremely oversold breadth indicators. We then looked at 2008 to compare Wednesday’s bounce with some of the other bear market bounces. The week ended with analysis of gold, the Yen, TLT, SPY and QQQ. Click here to take a trial and get immediate access to our reports and videos.
/////////////////////////////////////

