 Speaking overall, the stock market hasn’t changed course after last week’s bounce; the upside momentum is still here, albeit acting a little tentative. One piece of news that may have helped move the market higher on Tuesday, though, was President Trump’s decision to scale back on auto tariffs.
Investors seem to be looking forward to any news of progress on trade negotiations and key economic data, namely Q1 GDP, March personal consumption expenditures price index (PCE), and the April jobs report. There are also some important earnings this week, including META Platforms, Inc. (META), Microsoft Corp. (MSFT), Amazon.com, Inc. (AMZN), and Apple, Inc. (AAPL), among others. So, don’t be surprised if there’s some turbulence this week.
Recent economic data hasn’t moved the needle much. The latest JOLTS report showed fewer job openings in March, but layoffs declined. This indicates the labor market is still strong. The April nonfarm payrolls report on Friday will bring more clarity.
Consumer confidence took a hit, falling to its lowest reading since May 2020. This drop reflects concerns about tariffs and how they might push up prices. The bottom line is that consumers are nervous about what’s ahead.
Technical Update
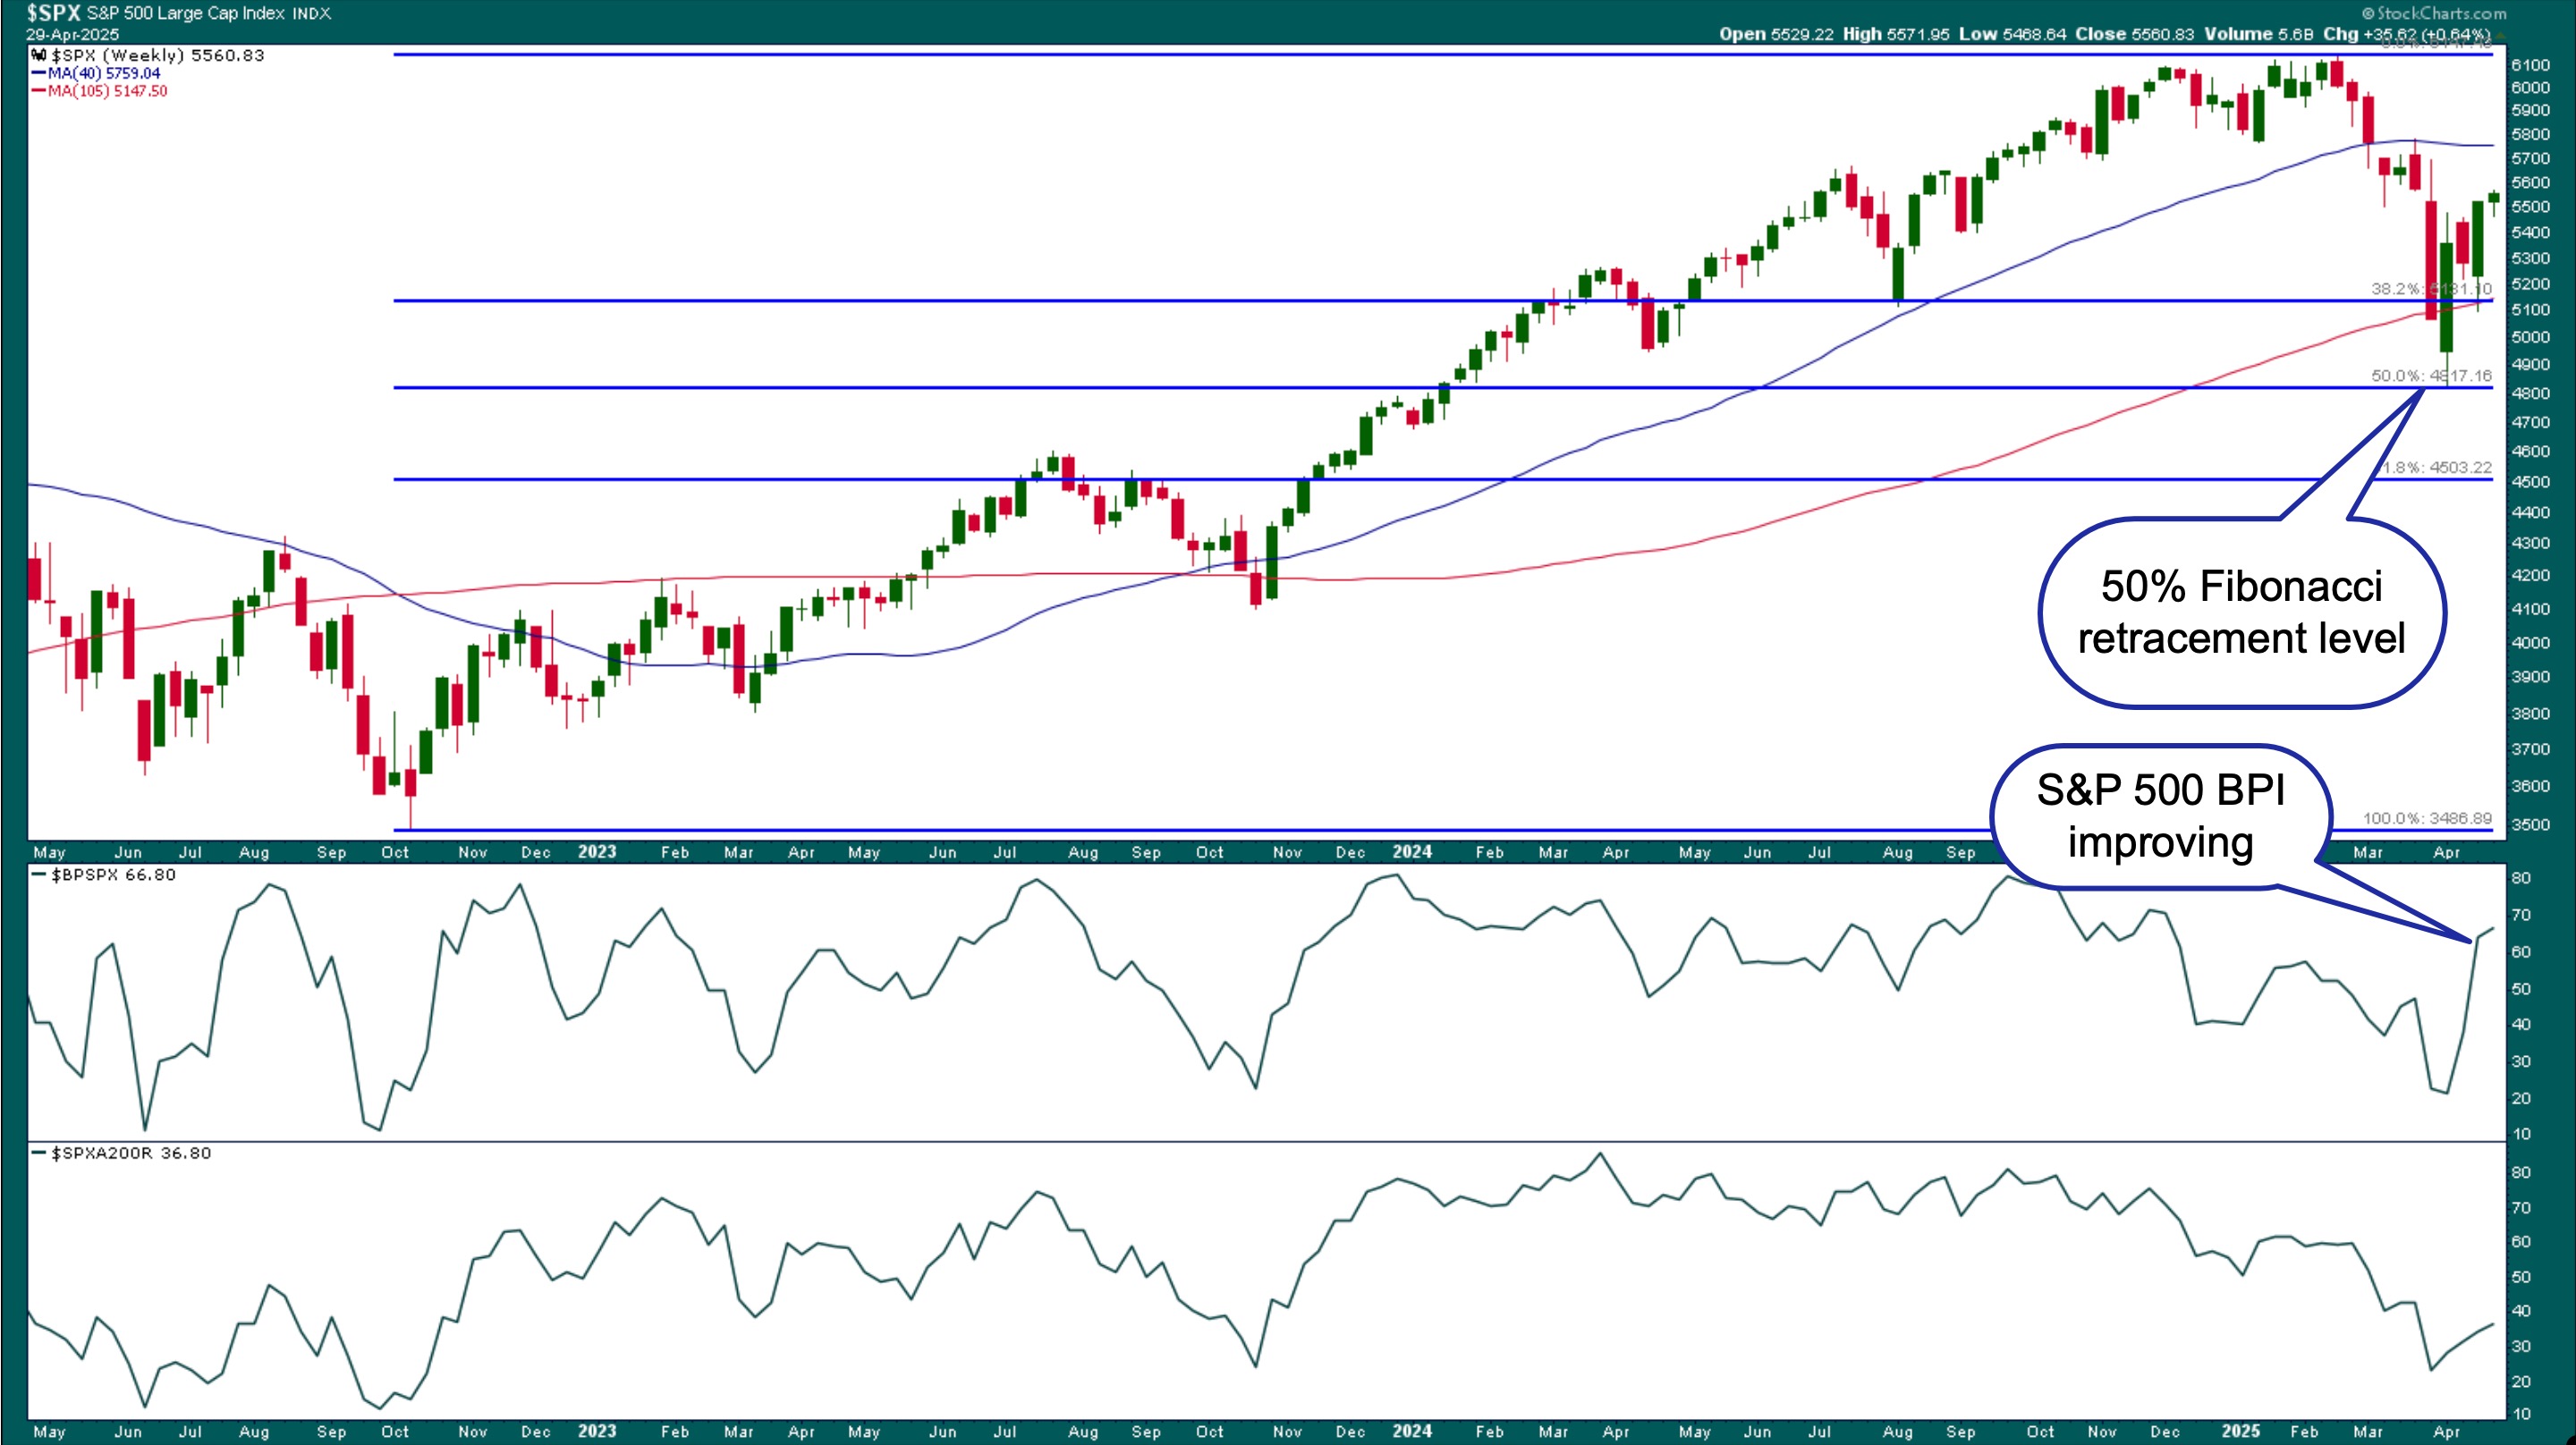
Despite its bounce, the S&P 500 ($SPX) is still down around 9.0% from its February high, but up about 15% from its April lows. The weekly chart below has the Fibonacci retracement levels from the October 2022 lows to the February 2025 highs. The index bounced off its 50% retracement level and is now above its 38.2% level. It’s also trading below its 40-week simple moving average (SMA), which is the equivalent of a 200-day SMA.

FIGURE 1. WEEKLY CHART ANALYSIS OF S&P 500. The index has bounced off its 50% Fibonacci retracement level, and breadth is improving. However, the market appears to be in a wait-and-see mode, and any negative news could send the index lower. Chart source: StockCharts.com. For educational purposes.
It’s encouraging to see the S&P 500 Bullish Percent Index (BPI) above 50%, and the percentage of S&P 500 stocks trading above their 200-day moving average showing slight signs of reversing from a downtrend. However, the S&P 500 appears indecisive and is waiting for some catalyst to move the index in either direction.
Does the daily chart show a different scenario? Let’s take a look.

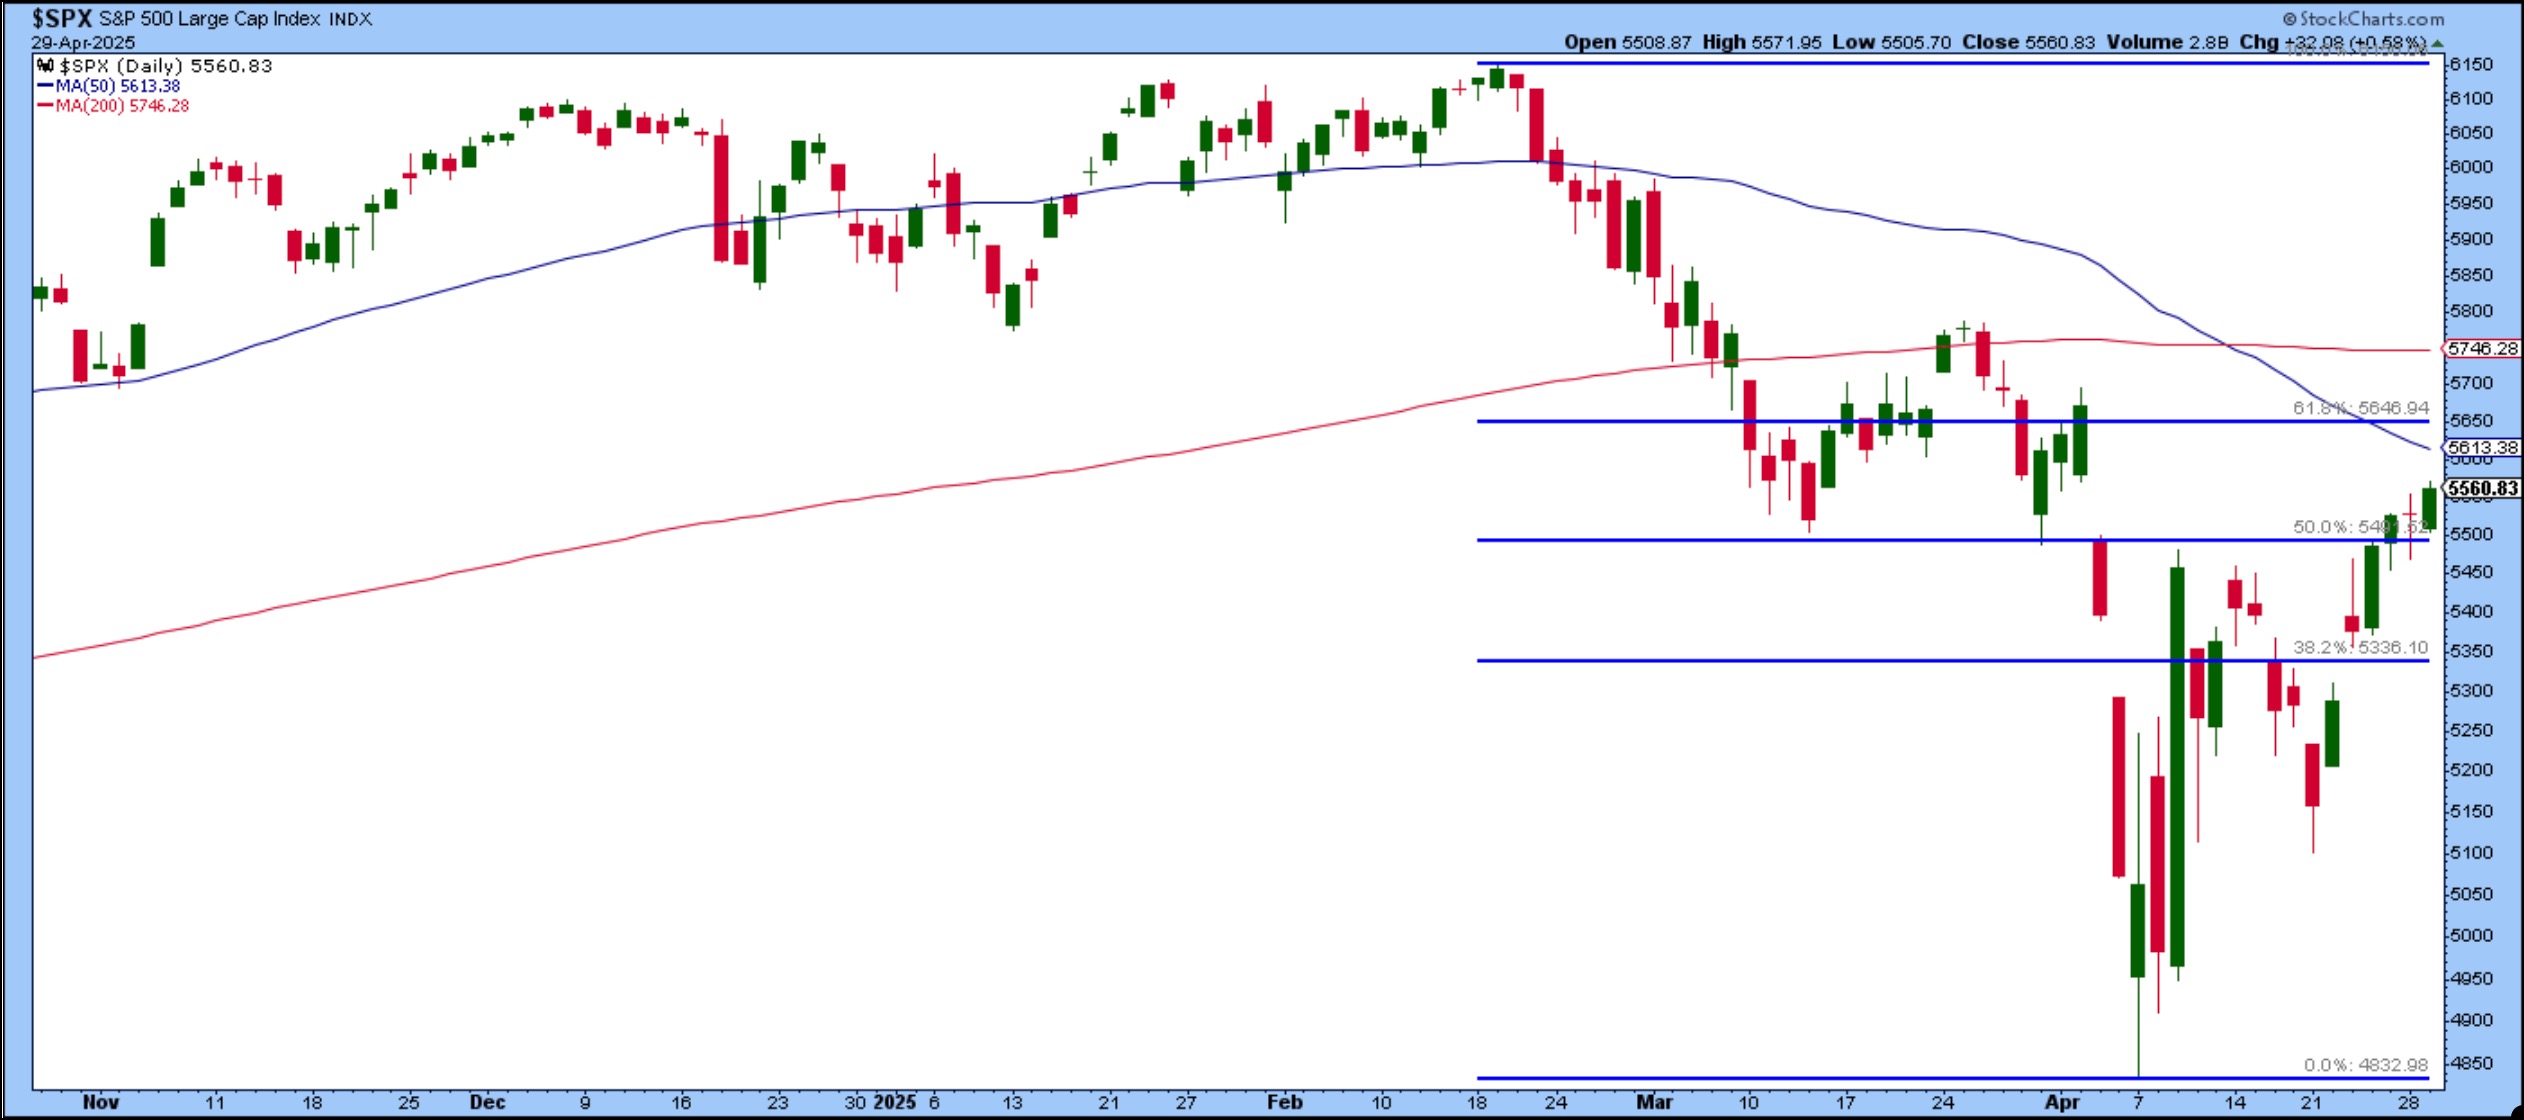
FIGURE 2. DAILY CHART ANALYSIS OF S&P 500. The 50% Fibonacci retracement level is an important level to monitor since it could act as a support level. Resistance levels to the upside are the 50-day moving average, the 61.8% Fib retracement level, and the 200-day moving average. Chart source: StockCharts.com. For educational purposes.
The daily chart of the S&P 500 above shows the index trading below its 200-day SMA. In addition, the 50% Fibonacci retracement level (from the February 2025 high to the April 2025 low) is acting as a support level. One point to note is the wide-ranging days in April, which have subsided toward the end of the month. This suggests investors have calmed down—the Cboe Volatility Index ($VIX) has pulled back and is now below 30.
The short-term perspective shows the trend is leaning toward moving higher. Keep an eye on the 5500 level as support and the 50-day SMA as the next resistance level. If the S&P 500 can break above the 61.8% Fibonacci retracement level with strong momentum, that’s reason to be optimistic. A break above the 200-day SMA would be more optimistic.
While the S&P 500 is inching higher, something is brewing beneath the surface—a shift toward the more defensive sectors.
Sector Rotation: Defensive Gains
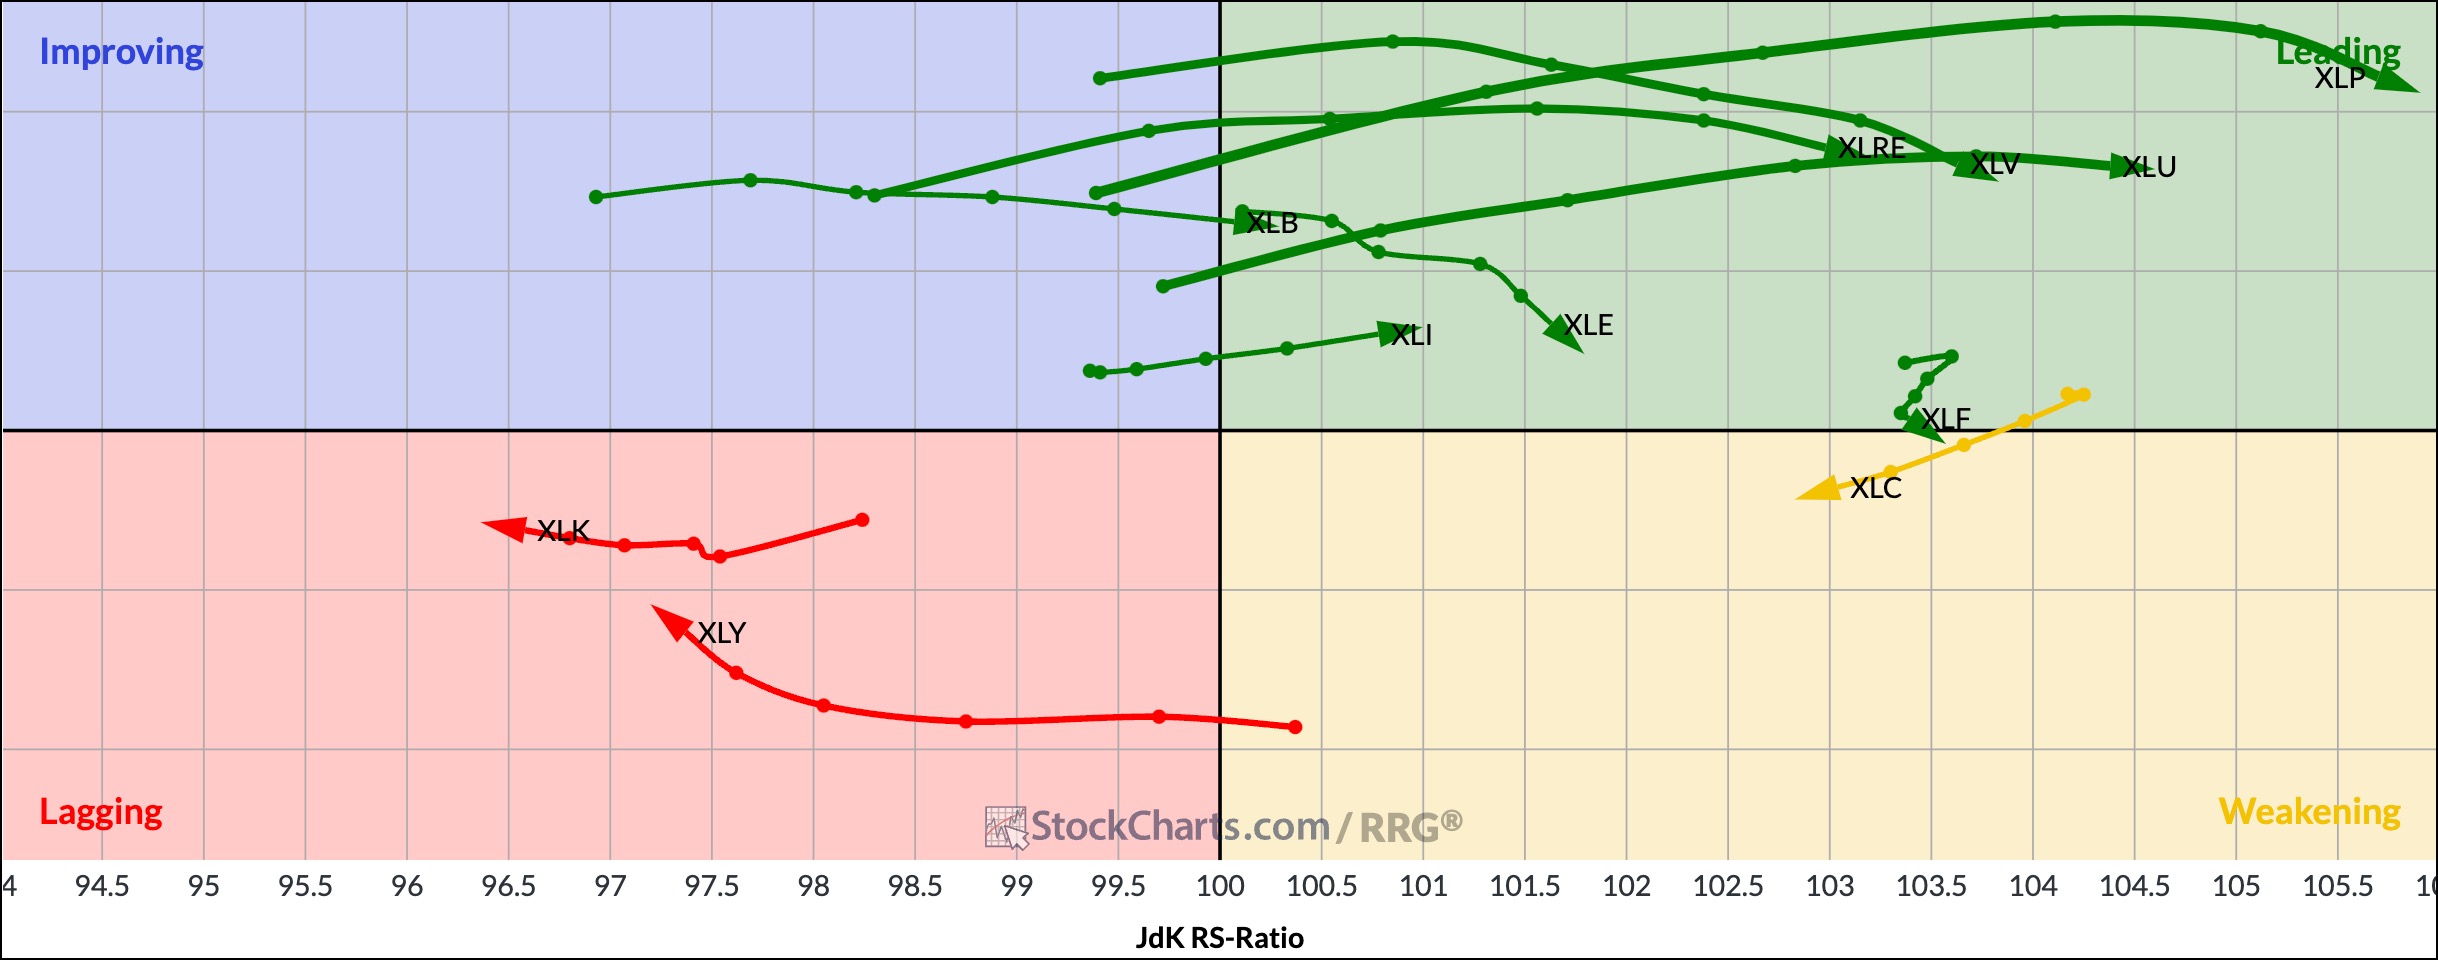
The Relative Rotation Graph below shows that for the week, defensive sectors—Consumer Staples, Utilities, and Health Care—are leading, while offensive sectors, like Technology, Consumer Discretionary, and Communication Services, are lagging.

FIGURE 3. RELATIVE ROTATION GRAPH. Defensive sectors are leading while offensive sectors are lagging. Monitor sector rotation carefully as we head into a volatile trading week. Chart source: StockCharts.com. For educational purposes.
This isn’t unusual, since investors are feeling more cautious and looking for stability.
What’s Ahead?

There’s still key economic data to monitor this week. Here’s what’s ahead:
- Wednesday: March personal consumption expenditures (PCE), the Fed’s favored inflation measure. A stronger-than-expected number could send the market lower since it may make the Fed more hawkish. There’s also the Q1 GDP growth, which will indicate if economic growth is stalling or continues to be strong.
- Friday: April nonfarm payrolls will give us an idea of the strength of the labor market. Evidence of a strengthening labor market would reduce the probability of an interest rate cut, which could put pressure on stocks.
Closing Position
The market is feeling cautious, waiting for the next catalyst to send stock prices higher or lower. And any of this week’s events—economic data, big tech earnings, and trade talks—could make or break this week’s price action. However, even if the S&P 500 trends higher, it doesn’t necessarily mean the big tech growth stocks are leading the move higher. Do a sector drill-down from our new Market Summary page and invest accordingly.
Disclaimer: This blog is for educational purposes only and should not be construed as financial advice. The ideas and strategies should never be used without first assessing your own personal and financial situation, or without consulting a financial professional.

